Sweet spreads - Page 37
Belongs to:
Contains:
- Almond spreads
- Beer spreads
- Caramel spreads
- Carob spreads
- Chocolate spreads
- Confectionary based spreads
- Flower preserves
- Fruit and vegetable preserves
- Fruit curds
- Ginger preserves
- Hazelnut spreads
- Honey-based preparations
- Honeys
- Milk jams
- Speculoos spreads
- Sweet spread variety packs
- Thick syrups
- Wine spreads
- Pistachio spreads
- fr:Pâtes à tartiner
Nutrition facts
Average nutrition facts for the 4743 products of the Sweet spreads category for which nutrition facts are known (out of 5609 products).
| Nutrition facts | As sold for 100 g / 100 ml |
Standard deviation | Minimum | 10th centile | Median | 90th centile | Maximum |
|---|---|---|---|---|---|---|---|
| Energy |
1,070 kj (257 kcal) |
187 kj (45 kcal) |
0 kj (0 kcal) |
699 kj (167 kcal) |
1,100 kj (263 kcal) |
1,300 kj (310 kcal) |
5,700 kj (1360 kcal) |
| Energy from fat |
440 kj (105 kcal) |
493 kj (118 kcal) |
0 kj (0 kcal) |
0 kj (0 kcal) |
460 kj (110 kcal) |
1,650 kj (394 kcal) |
1,830 kj (437 kcal) |
| Fat | 0.005 g | 0.053 g | 0 g | 0 g | 0 g | 0 g | 71.4 g |
| Saturated fat | 0.076 g | 0.564 g | 0 g | 0 g | 0 g | 0 g | 28.6 g |
| Monounsaturated fat | 10.4 g | 12.3 g | 0 g | 0 g | 0 g | 28.1 g | 30.3 g |
| Polyunsaturated fat | 4.66 g | 4.94 g | 0 g | 0 g | 2.22 g | 12.5 g | 16.7 g |
| Trans fat | 0 g | 0 g | 0 g | 0 g | 0 g | 0 g | 2.94 g |
| Cholesterol | 0 mg | 0 mg | 0 mg | 0 mg | 0 mg | 0 mg | 250 mg |
| Salt | 0.023 g | 0.045 g | 0 g | 0 g | 0 g | 0.132 g | 13.8 g |
| Carbohydrates | 66.5 g | 13.6 g | 0 g | 40 g | 65 g | 81 g | 385 g |
| Fiber | 0.748 g | 1.62 g | 0 g | 0 g | 0 g | 5 g | 90 g |
| Sugars | 59.3 g | 16.3 g | 0 g | 33.3 g | 60 g | 81 g | 7,600 g |
| Added sugars | 43.3 g | 18.9 g | 0 g | 0 g | 45 g | 61.9 g | 90 g |
| Polyols (sugar alcohols) | 19.7 g | 7.63 g | 12 g | 12 g | 18 g | 76 g | 76 g |
| Proteins | 0.028 g | 0.193 g | 0 g | 0 g | 0 g | 0 g | 33.5 g |
| Alcohol | 0 % vol | 0 % vol | 0 % vol | 0 % vol | 0 % vol | 0 % vol | 1 % vol |
| Vitamin A | 25.7 µg | 68.2 µg | 0 µg | 0 µg | 0 µg | 167 µg | 2,760 µg |
| Vitamin D | 0.062 µg | 0.295 µg | 0 µg | 0 µg | 0 µg | 1.48 µg | 2.7 µg |
| Vitamin C (ascorbic acid) | 12 mg | 18.5 mg | 0 mg | 0 mg | 5 mg | 50 mg | 2,250 mg |
| Vitamin B9 (Folic acid) | 18.7 µg | 4.66 µg | 0 µg | 17 µg | 20 µg | 21 µg | 120 µg |
| Calcium | 6.26 mg | 20.5 mg | 0 mg | 0 mg | 0 mg | 53 mg | 14,000 mg |
| Iron | 0.176 mg | 0.496 mg | 0 mg | 0 mg | 0 mg | 1.38 mg | 18 mg |
| Potassium | 96.4 mg | 146 mg | 0 mg | 0 mg | 48 mg | 472 mg | 1,380 mg |
Country: United States - View matching products from the entire world
5,609 products
-
Wildflower Honey - 17 oz

-
Jackie's jams

-
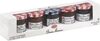
Gift ounces - Bonne Maman
-
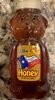
100% pure honey
-
Tupelo raw honey - 3 oz

-
Honey
-
Kickin’ Maple Honey - 11 oz

-
Original whipped honey
-
Pure clover honey
-
Honey - Great Lakes - 16 oz

-
Flower Honey - Ziyad

-
Allen’s Honey - 12 oz
-
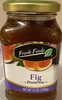
Fig Preserves - - 12 oz
-
Homemade jam
-
American Raw Blueberry Honey

-
A natural fruit spread
-
100% raw pure tiaca honey
-
Wildflower honey - 16 oz

-
Organic light agave sweetener
-
Honey blend - 5 lbs

-
Pure Iowa Raw Honey - 24 oz
-
Strawberry Rhubarb A Delicious Spring Mating

-
Pure natural honey
-
Honey substitute - 14 oz

-
Mediterranean date spread with orange blossom & rose water
-
Blackcurrant Jam

-
Umf 15+ honey, manuka
-
All Natural Pure Clover Honey - 32 oz

-
Raw honey - 44 oz

-
Cranberry jam
-
100% Pure Georgia Raw and Unfiltered Honey
-
Guava jam
-
100% Pure, Raw, and Natural Clover Honey

-
Carrot jam
-
Wildflower Honey - 16 oz

-
Nate’s Honey - 48 oz
-
Concord Grape Jelly - Meijer
-
Organic Wild Blueberry

-
Seedless blackberry jam
-
Dutch clover honey jersey fresh - 12 oz
-
Peach - Signature Kitchens
-
Tequila jalapeno deliciousness
-
Honey - 16 oz

-
Pure honey
-
Raw bee honey reserva palo verde

-
Raw honey - 192 oz
-
Habanero-jelly with rosemary
-
wildflower honey

-
100% pure honey
-
Organic greek yogurt with whole milk with red raspberry - Wegmans Organic
-
JAM
-
Honey

-
Fruit spread
-
Desert Bloom Pure Raw Honey - Rango Honey - 12 oz
-
Organic 100% pure raw honey
-
Pure Honey wildflower

-
Pure pacific northwest honey
-
Foodtown concord grape jelly sweetened with grape -
-
Oregon pumpkin butter, oregon pumpkin
-
Australian Manuka Honey

-
Cox’s Honey - 12 lbs
-
100% pure honey
-
Honey - Big Win
-
Preserves
-
Marionberry preserves
-
creamy highland honey - 16 oz

-
Natural Clover Honey - Bell-View - 12 oz
-
Raw honey

-
All Natural Unfiltered Honey - Farmer Ban‘s - 12 oz

-
Topanga quality honey
-
Raw Honey

-
Light agave nectar
-
Australian Manuka Honey - 14 oz
-
Fruit & Jell Mandarin - Sunkist - 300 g
-
Honey

-
Clover honey - 40 oz

-
Preserves
-
Hot honey
-
Premium meyer lemon & blood orange pepper jelly
-
Pure Honey With Comb U.S Grade A Fancy - La Preferida - 15 oz

-
Muscadine jelly
-
Raw Honey

-
Honey bee
-
Peach preserves - Our Family

-
Wild Honey

-
Strawberry Jelly - Harris Teeter
-
Ginger pepper jam
-
Private Selection Raw & Unfiltered Honey - 16 oz

-
Wild swedish lingonberries stirred with sugar
-
525 MGO Manuka Honey 8.75 oz
-
Jam - The Jam Shoppe

-
Pure Honey Unfiltered - 22 oz

-
Raspberry jam
-
seedless red raspberry jam -
-
Honey - - 60 lbs

-
Hillcrest pure honey

-
Raspberry Jam
-
Real Raw Honey - 40 oz

-
Pure Raw Honey US Grade A - 23 oz

-
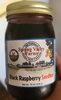
Black raspberry jam - 19 oz